Zhang Lab
Research Projects
Advanced AO Retinal Imaging
Adaptive optics (AO) for retinal imaging: In vivo imaging of the retina must use the eye’s optics as objective lens, which is not a perfect optical system but has many defects (described by the wave aberrations of imaging light). AO is a technique that can compensate these defects thereby enabling diffraction (or near-diffraction) limited image resolution.

Figure 1 Retinal imaging is impeded by the wave aberration of the ocular optics. A classical AO system consists of a wavefront sensor (typically a Shack-Hartmann wavefront sensor) that measures the wave aberration, and a wavefront corrector (typically a deformable mirror: DM) that ‘nulls’ the wave aberration through a dynamic automatic control mechanism.

Figure 2 AO’s triple benefits to retinal imaging
- Adaptive optics scanning laser ophthalmoscopy and optical coherence tomography (AO-SLO-OCT)
This instrument integrates AO, scanning laser ophthalmoscopy (SLO), and optical coherence tomography (OCT), achieving diffraction (or near diffraction) limited resolution in both the en face and the cross-sectional plane. An important feature of this instrument is its advanced AO wavefront correction strategy that enables high resolution and high quality retinal imaging can be achieved in aging eyes with irregular pupil shape, cataract, and opaque intraocular lens. This ability significantly facilitated clinical study of the elderly patients with age-related macular degeneration.

Figure 3. AO-SLO-OCT instrument and retinal image taken in a normal human subject. The bright spots in the AO-SLO images are cone photoreceptors. Each AOSLO image is a registered set of 20 AO-corrected images. All images have been corrected for distortions due to eye movements and the nonlinear scan. The arrows on the AOSLO images indicate the position and direction of the OCT scan, the arrow direction corresponds to right to left in the AOOCT images. The green squares on the AOSLO montage show where the enlarged AOSLO images are located.

Figure 4 AOSLO imaging of cone and rod photoreceptors. Left panel was taken in the fovea of a human subject with normal healthy retina. Right panel was taken along the equator of the retina nasally about 9° away from the foveal center, revealing that cones (the large spots with dark annulus) are surrounded by rods (small spots).

Figure 5 Cone photoreceptor density along primary retinal meridians in fellow eyes assessed by adaptive optics scanning laser ophthalmoscopy. The shaded region covers 1 standard deviation range of cone density values at corresponding eccentricity reported by Curcio et al (Curcio CA, et al. J Comp Neurol. 1990; 292(4):497-523.).
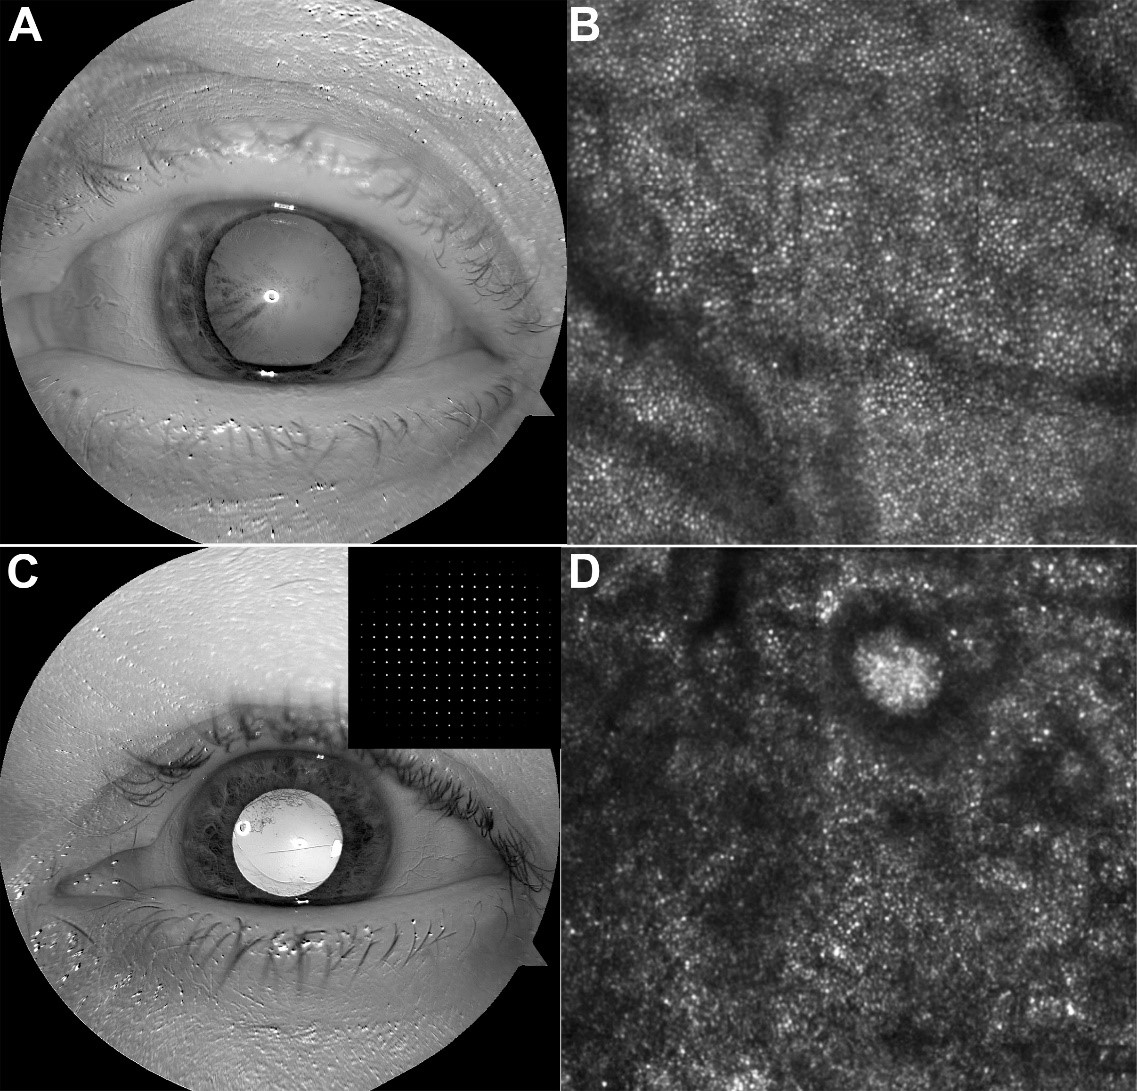
Figure 6. Advanced AO wavefront correction enables high resolution and high quality retinal imaging in aging eyes with irregular pupil shape, cataract, and opaque intraocular lens. A & C Enhanced red channel of the color fundus reflex images showing pupil shape and lens clarity. Insets show the sampling points on the Shack-Hartmann wavefront sensor through the irregular pupil. Corresponding retinal images taken from these eyes are shown in B and D, respectively. Retinal images are of 1° X 1°and were acquired at approximately 2° superior to the foveal center.
- High speed adaptive optics near-confocal ophthalmoscope (AONCO)
The AONCO operates with a parallel confocal scanning imaging mechanism. It employs a near infrared (NIR) low coherence superluminescent diode (λ = 795 nm) as the imaging light source, and uses a digital micro-mirror device to modulate the imaging light into a line of point sources illuminating the retina. It uses a high-speed line camera to acquire the retinal image through an anamorphic imaging mechanism. The line camera acts as a confocal gate rejecting out-of-focus scattering light. The AO consists of a high-speed Shack-Hartmann wavefront sensor and a deformable mirror with 97 actuators with stroke up to 30 μm. Advanced wavefront detection and correction strategy developed in the AOIL can correct the wavefronts in eyes with irregular pupil shape, cataract, and opaque intraocular lenses in the elderly human subjects’ eyes. The AONCO can image the living human retina with cellular level resolution at a frame rate of 800 FPS over a field of view of 2.4º × 0.6º with a digitization of 1024 × 256 pixels.

Figure 7. AONCO
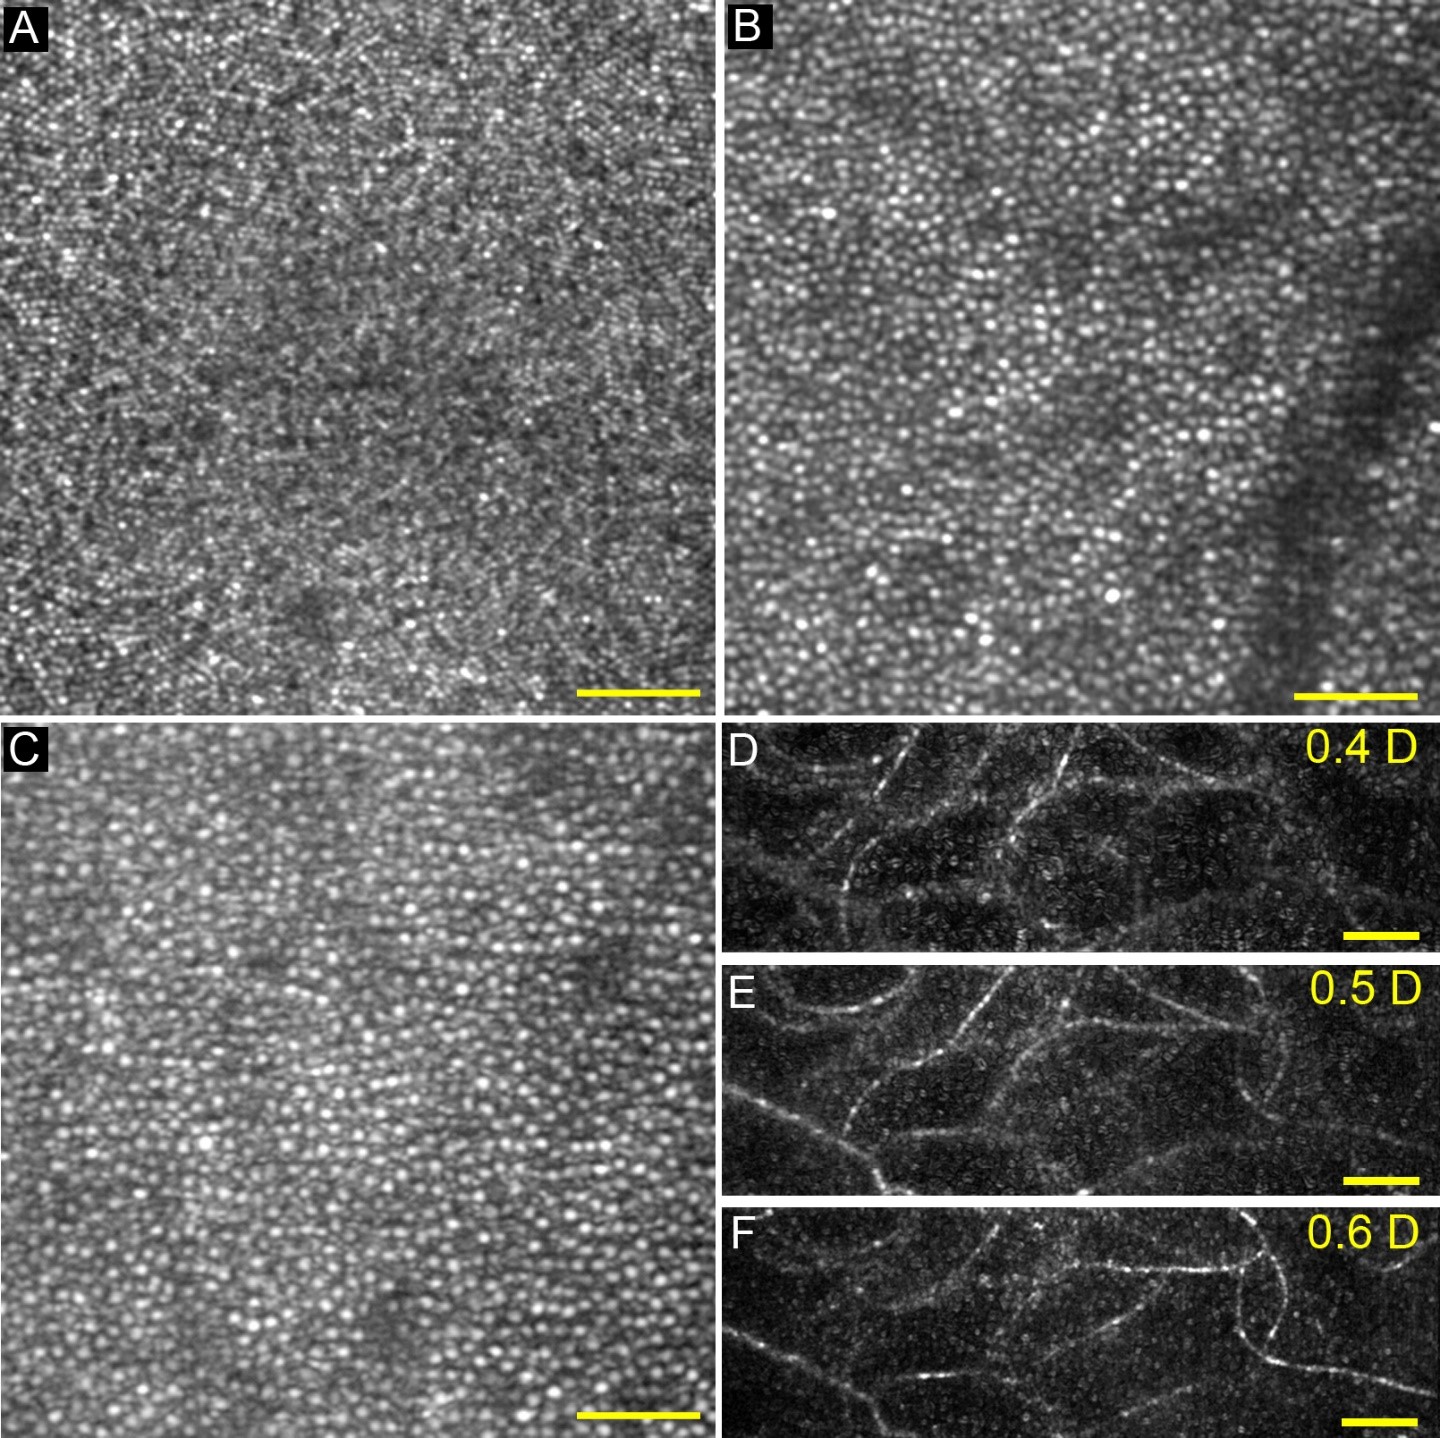
Figure 8. AONCO imaging of photoreceptor and retinal capillary. (a) Retinal image acquired at the fovea. (b) Retinal image acquired at the eccentricity of 1.8° nasally. All cells are cone photoreceptors. Images in (a) and (b) are in linear grey scale. (c) Retinal image acquired at the eccentricity of 5° nasally, revealing cones (larger and brighter dots) and surrounding rods (smaller dots). The image is in logarithmic scale. All images were taken from an eye of a subject with normal retinal health, and registered from a set of 100 successive frames. (d) – (f) Retinal capillaries imaged at different depths. The numbers on top right corners of the panels indicate the imaging light defocus power (in diopter: D) induced by the deformable mirror while AO was correcting the ocular wave aberration. Zero D corresponds to the plane of the inner segment layer of the cone photoreceptors. The capillaries were extracted using the standard deviation of a sequence of 50 successive images. All images were acquired with a frame rate of 200 FPS. Scale bars represent 50 μm.

Figure 9. AONCO improves retinal image fidelity. The repeatability of cone mosaic metrics assessed in images acquired with different frame rate at 1° eccentricity nasally in a subject with normal healthy retina. (a), (b), and (c) are Voronoi diagrams of the ROI in images acquired at 100 FPS, 200 FPS, and 800 FPS, respectively. Blue Voronoi cells are 6-sides, and red ones are not. (d) Cone density (CD) repeatability under different frame rates. (e) Percentage of six-sided cells (PSSC) repeatability. (f) Intercellular distance (ICD) repeatability. (g) Nearest neighbor distance (NND) repeatability. (h) Nearest neighbor regularity (NNR) repeatability. (i) Voronoi cell area regularity (VCAR) repeatability. Error bars indicate 1 standard deviation (SD). Numbers above the bars are the coefficients of variation (CV) from 12 series measurement of this metric.
- High speed adaptive optics control strategy
The frequency of temporal fluctuation of human ocular wave aberration is typically 30 Hz, dictating the necessity of high speed AO correction. We have developed high speed AO system for adaptive optics scanning laser ophthalmoscope (AOSLO). The high speed AO can be operated with a closed-loop frequency of 100 Hz. Experiment results demonstrated that the high speed AO system can provide improved compensation for the wave aberration up to 30 Hz in the living human eye.
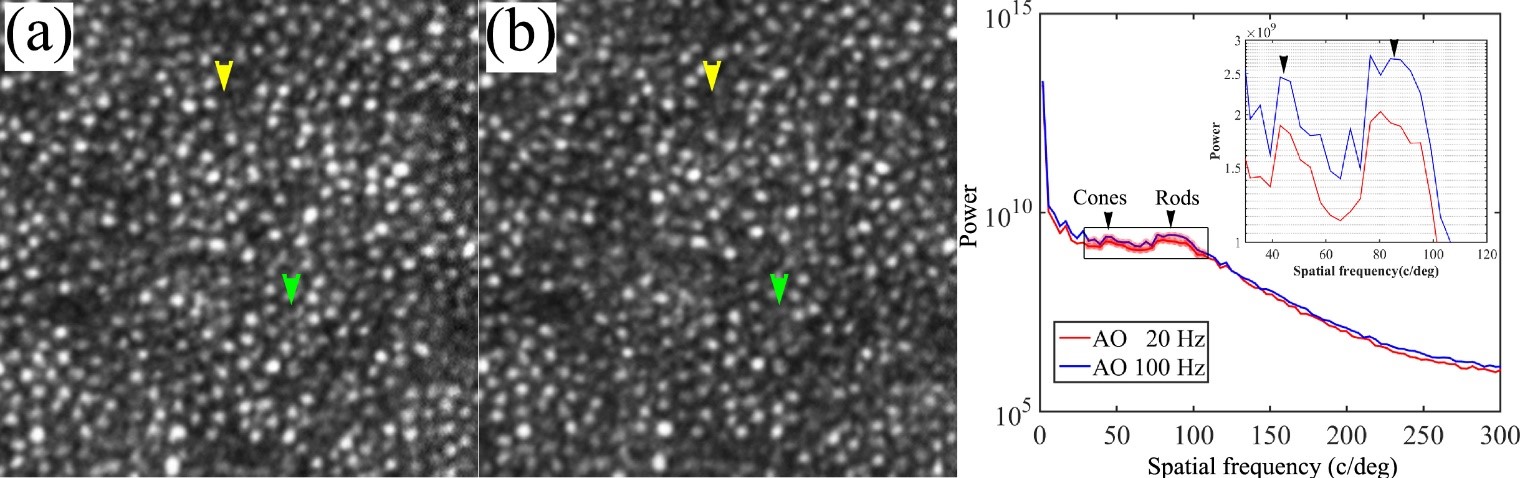
Figure 10. AOSLO images taken with 100 Hz AO (a) and 20 Hz AO (b). The images were acquired at 3 degrees eccentricity nasally along the primary horizontal retinal meridian. The size of these images is 256 pixels subtending a field of view of 0.53 degree. Radial power spectra of the retinal images taken with 100 Hz AO and 20 Hz AO correction. Each plot is an average of the radial power spectra of 75 successive retinal images within a 5-second video from one subject. Black arrowheads point to the peaks corresponding to cones (~41 cycles/degree) and rod (~90 cycles/degree). The inset is the magnified spectral region indicated by the box over which the improvement of power spectra by the 100 Hz AO correction is 18-56%.
In Vivo Ultrastructure of Choriretinal Disease
Age-related macular degeneration (AMD) is a leading cause of irreversible vision loss in more than 10 million older Americans. It is a multifactorial disease of the photoreceptor support system, including the retinal pigment epithelium (RPE) and choroidal vasculature, eventually impacting the photoreceptors. It has long been recognized that a major early sign of AMD is the accumulation of drusen in the sub-RPE space. However, our knowledge is being challenged by recent recognition of pseudodrusen, now called subretinal drusenoid deposits (SDD), in the subretinal space that is on the other side of the blood-retina barrier to drusen. This disparate location implies different impact on overlying photoreceptor cells, different processes leading to late stage AMD, and different biogenesis mechanisms. The revelation of SDD represents a major discovery in the pathophysiology of AMD. The objectives of our research are two-fold: better understanding of SDD’s role in the pathophysiology of AMD, and developing AO imaging based biomarkers for sensitive and quantitative assessment of photoreceptor degeneration in AMD. Using a state-of-art high resolution AO-SLO-OCT that was developed in the AOIL, we have conducted in vivo ‘microscopy’ of SDD in the eyes of living patients.
Major findings include: 1) We have proven that SDD are extracellular lesions accumulating in the subretinal space and impact photoreceptors’ optical properties, structure, and function. 2) SDD are dynamic and have a life cycle of distinct stages of progression and regression. 3) AOSLO imaging combined with SDOCT revealed in detail altered fine structure of SDD and surrounding photoreceptors during the development of outer retinal atrophy. 4) SDD are associated with RPE degeneration. 5) Rod photoreceptor function is particularly affected in eyes with SDD, more so than cones. 6) High-resolution AOSLO revealed new pathological entities in AMD including outer retinal tubulation and Friedman lipid globules.

Figure 11. AO-SLO-OCT imaging of AMD. A, AOSLO montage is overlaid on the fundus photograph. B, AO-OCT, as indicated by the green arrow B in panel A, reveals hyperreflective and discrete granules in the lesion. These granules look very similar to those inside the hyporeflective annulus by AOSLO in panel D, indicating the granular structure is the lesion itself, not photoreceptor cells. This demonstrates our ability to image the microstructure of the lesion as well as the retinal cells. C, SD-OCT taken along the green arrow-line C in panel A shows a SDD breaking the EZ band, which is magnified in panel E. D, AOSLO of the retina in the box in panel A. The subject is an 83-year-old man with non-neovascular AMD (AREDS grade 7).

Figure 12. AOSLO imaging of SDD dynamism. A. AOSLO montage (in grey scale) is overlaid on the digital fundus photograph of 30° field of view. B & C. AOSLO images of the retina area shown in the yellow box in (A) taken at baseline and 2nd visit (14 months later), revealing SDD progression. A stage 1 lesion progressed to stage 3 (green arrowheads), and a stage 2 lesion progressed to stage 3 (aqua). Stage 3 lesions may expand (yellow arrows), shrink (red arrowheads), and disappear (yellow and magenta arrowheads). New lesions can develop (green arrows). D & E.Stage-specific changes in SDD appearance are also clear in corresponding spectral domain optical coherence tomography (SD-OCT) B-scans, as indicated by green lines with arrows in (B) and (C). The subject is an 84-year-old (at the baseline study) woman with non-neovascular AMD.

Figure 13. AOSLO imaging of SDD impact on chorioretinal structure during natural progression/regression history. A – D are AOSLO images at 4 follow-ups. Color arrowheads point to SDD at defferent stages. Hyperreflective dots outside hyporeflective annular structure are unaffected cone photoreceptors. E-H are OCT images acquired at a position represented by the green lines in A – D, indicating SDD arein subretinal space. Over 3.5 years, some deposits grow (magenta, green, and teal arrowheads) and some shrink (yellow arrowhead). Deposit morphology can change during both phases (teal, acquiring divots during growth, and yellow, becoming rectangular during shrinkage). The patient was a 73 years old man with noneovascular AMD at ARED step 7. ILM: Internal limiting membrane, which is the inner noundary of the ONF. ONF: Optic nerve fibers. GCL: Ganglion cell layer. IPL: Inner plexiform layer. INL; Inner nuclear layer. OPL: Outer plexiform layer. HFL: Henle Fiber layer. ELM: External limiting membrane. EZ: elipsoid zone. RPE: retinal pigment epithelium. BL: basal lamina. BrM: Bruch’s membrane. The RPE-BL-BrM band includes the hyperreflective RPE, hyporeflective basal laminar deposit, and hyperreflective BrM. Due to space limitations, the entire complex is labeled together in panel E. Scale bar = 100 μm.
High-Order Retinal Capillary Hemodynamics
Microcirculation in retinal capillaries plays a critical role in support of the intense metabolic activities of the inner retinal tissue in the human eye. However, this process can be disrupted by common eye diseases, systemic diseases, or CNS disorders. Therefore, accurate assessment of retinal hemodynamics at the capillary level is critical to understanding normal physiologic processes and pathologic conditions in the retina and facilitating novel treatments for retinal diseases. AONCO can precisely measure the flow dynamics in the smallest to largest retinal vessels in the living human eye.
- High-speed, high-resolution AONCO enables direct and accurate measurement of the movement of individual erythrocytes and leukocytes flowing in retinal capillaries in the living human eye without using exogenous contrast agents. AONCO uses infrared imaging light, thereby allowing for imaging of the erythrocytes within retinal capillaries over long periods in the living human eye without disturbing the normal physiological state of the retina or initiating a phototoxic result in the retina.
- The high temporal resolution of the AONCO revealed that the erythrocyte flow in retinal capillaries was pulsatile and cardiac dependent. This finding challenges our classical knowledge of blood flow in the capillary system and has significant implications for understanding the oxygen transfer process from the erythrocytes to tissue and the capillary function.
- High temporal imaging ensures an accurate measurement of the erythrocytes’ cardiac-dependent acceleration and deceleration movements, allowing for measuring not only the velocity but also the acceleration and its change, i.e., high-order dynamics of the erythrocyte movement. New biomarkers characterizing high-order dynamics reflect the hemodynamic forces driving the flow, thereby informing the mechanical property of the retinal capillary-erythrocyte system.
- Measuring high-order hemodynamic characteristics in subjects in normal health has disclosed age-related differences in the erythrocyte movement that low-order metrics cannot identify. The measurements in subjects with essential hypertension and age-similar normals revealed systemic condition-related abnormalities in capillary flow dynamics.

Figure 14. Precise characterization of retinal hemodynamics in the smallest to largest retinal vessels in the living human eye.
When imaging the blood flow in vessels with a diameter < 10 μm, retinal images were acquired with a full 2D raster scanning mode. Blood velocity was measured by the spatiotemporal traces of the red blood cells. A. Three capillaries were imaged by AONCO. Erythrocyte flux measured in 2 capillaries is listed. B &C. Spatiotemporal traces of the erythrocytes flowing in the 2 capillaries showing panel A, in one cardiac cycle indicated by the red and blue lines. Each hyper-reflective line represents the trace of one erythrocyte. D. Cardiac pulse (C.P.) wave that was recorded simultaneously with the retinal images. E. Erythrocyte flow velocity in 2 capillaries shown in panel A.
When measuring blood flow in vessels with a diameter > 10 μm, the scanner was programmed to stop across the vessel in a frame, thereby directly generating the spatiotemporal traces of the red blood cells within the vessel. G & H show the spatiotemporal traces of erythrocytes in an arteriole with a lumen diameter of 110 μm imaged at 2 time points within a cardiac cycle. I. Cross-sectional profiles of the blood flow velocity measured from the spatiotemporal traces in panels G & H. J. Cross-sectional profiles of the blood velocity measured in 3 cardiac cycles. K. Cardiac-dependent blood velocity at the center of the vessel lumen (cross-section position 7 in panel J). L. The acceleration of the blood flow calculated from the continuous blood velocity.

Figure 15. Spatiotemporal traces of the erythrocyte flow in capillaries with different cell flux. Each plot represents the erythrocyte flow in one cardiac cycle (horizontal). All panels have been adjusted to be of the same size for display purpose. The numbers on the left are the erythrocytes counted within one cardiac cycle. All spatiotemporal plots were extracted from retinal images acquired at 800 fps, with the imaging light focused on the capillary bed.
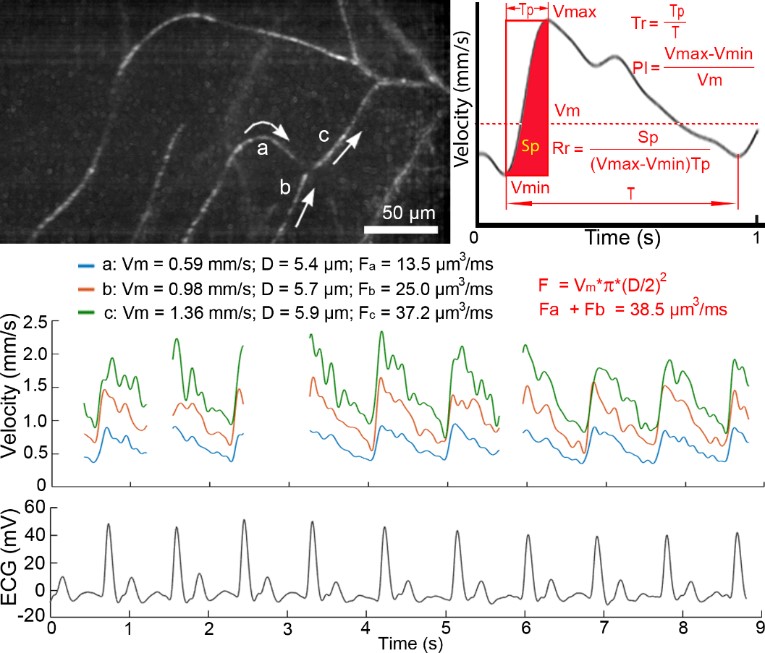
Figure 16. Cardiac-dependent velocity fluctuation of the erythrocyte in retinal capillaries. Top left panel shows 3 capillaries within which the erythrocyte velocity was measured. White arrows indicate the flow directions. Middle panel shows the velocity waveforms measured in the 3 capillaries. Gaps in the waveforms were caused by eye blinks during imaging. Bottom panel is the ECG that was recorded simultaneously with the retinal images. Top right panel illustrates the velocity waveform averaged from multiple cardiac cycles. Vmax: the maximum velocity. Vmin: the minimum velocity. Vm: the mean velocity. PI: Pulsatility index of the blood flow. Tp: the time span over which the erythrocyte velocity is accelerated from Vmin to Vmax. T: cardiac period. Tr: acceleration time index of the erythrocytes, which is a measure of the interaction between the erythrocytes with the blood vessels. Sp: the distance that the erythrocytes have flowed in the blood vessel during the period of being accelerated within a cardiac cycle. Rr: the raising rate of the erythrocyte velocity, which is a normalized measure of the distance that the erythrocytes travel within a cardiac cycle. Fa, Fb, Fc: flow rates in vessels a, b, and c, respectively. D: the diameter of the capillary. The blood flow was calculated using the formula , assuming that the capillaries were cylindrically symmetric, with a round cross-section shape. The retinal images were acquired with the imaging light focused on the capillaries.